North and West Melbourne Data Analytics Hub
The North and West Melbourne Data Analytics Hub gives businesses an opportunity to harness student skills, analyse the data they collect and use that data to build business capability.
Project Partners


The Hub works with students from La Trobe University, RMIT University, Victoria University, Melbourne Polytechnic and Kangan Institute to help businesses use their data to their best advantage.
The placements can address a variety of business issues, including:
- data capturing and measurement
- definition, cleaning and governance of data
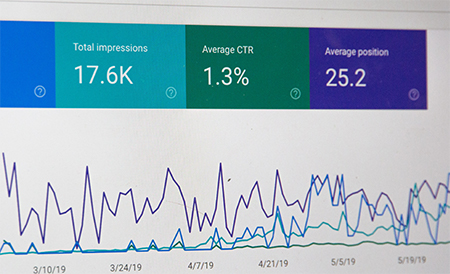
- development and visualisation
- statistical analysis and reporting
- forecasting
- basic machine learning.
Globally, businesses are realising the huge benefits that data analytics present. All organisations gather data – business to consumer, business to business or internal. Many are aware that they can improve their operations through understanding this data, but do not have the time, knowledge and/or resources to properly make use of it.
The Hub was established to provide real value to businesses. University and TAFE students matched to organisations through the Hub are able to stretch each client business into a new direction. This could be through a new product or service, a new way of operating or by producing evidence that can form the foundation for future business decisions.
During their data analytics placement, students tackle a real workplace project. They see how their skills can positively impact a business and they increase their own employability.

Background
While all organisations collect data, most do not use the information they have. Many perceive data analytics as highly advanced or something beyond them. Some do not understand the power of data analytics, some understand but do not have the resources and expertise to implement change, and others are early adopters who want to keep up with the latest innovations.
At the same time, younger people are increasingly seeing data analytics as a viable field for a career. Uptake of data related subjects and courses in tertiary institutions continues to grow, and the employment market across all sectors highly values practical experience. The Hub links these groups, offering students the chance to demonstrate their knowledge and skills while giving industry the opportunity to test the viability of data analytics in their business – with little risk.
Educational partners


Project types
Students in this program come from all disciplines of data analytics – from PhD and Masters to undergraduate, diploma and certificate.
Businesses can sign up to a big or small project, specifically:
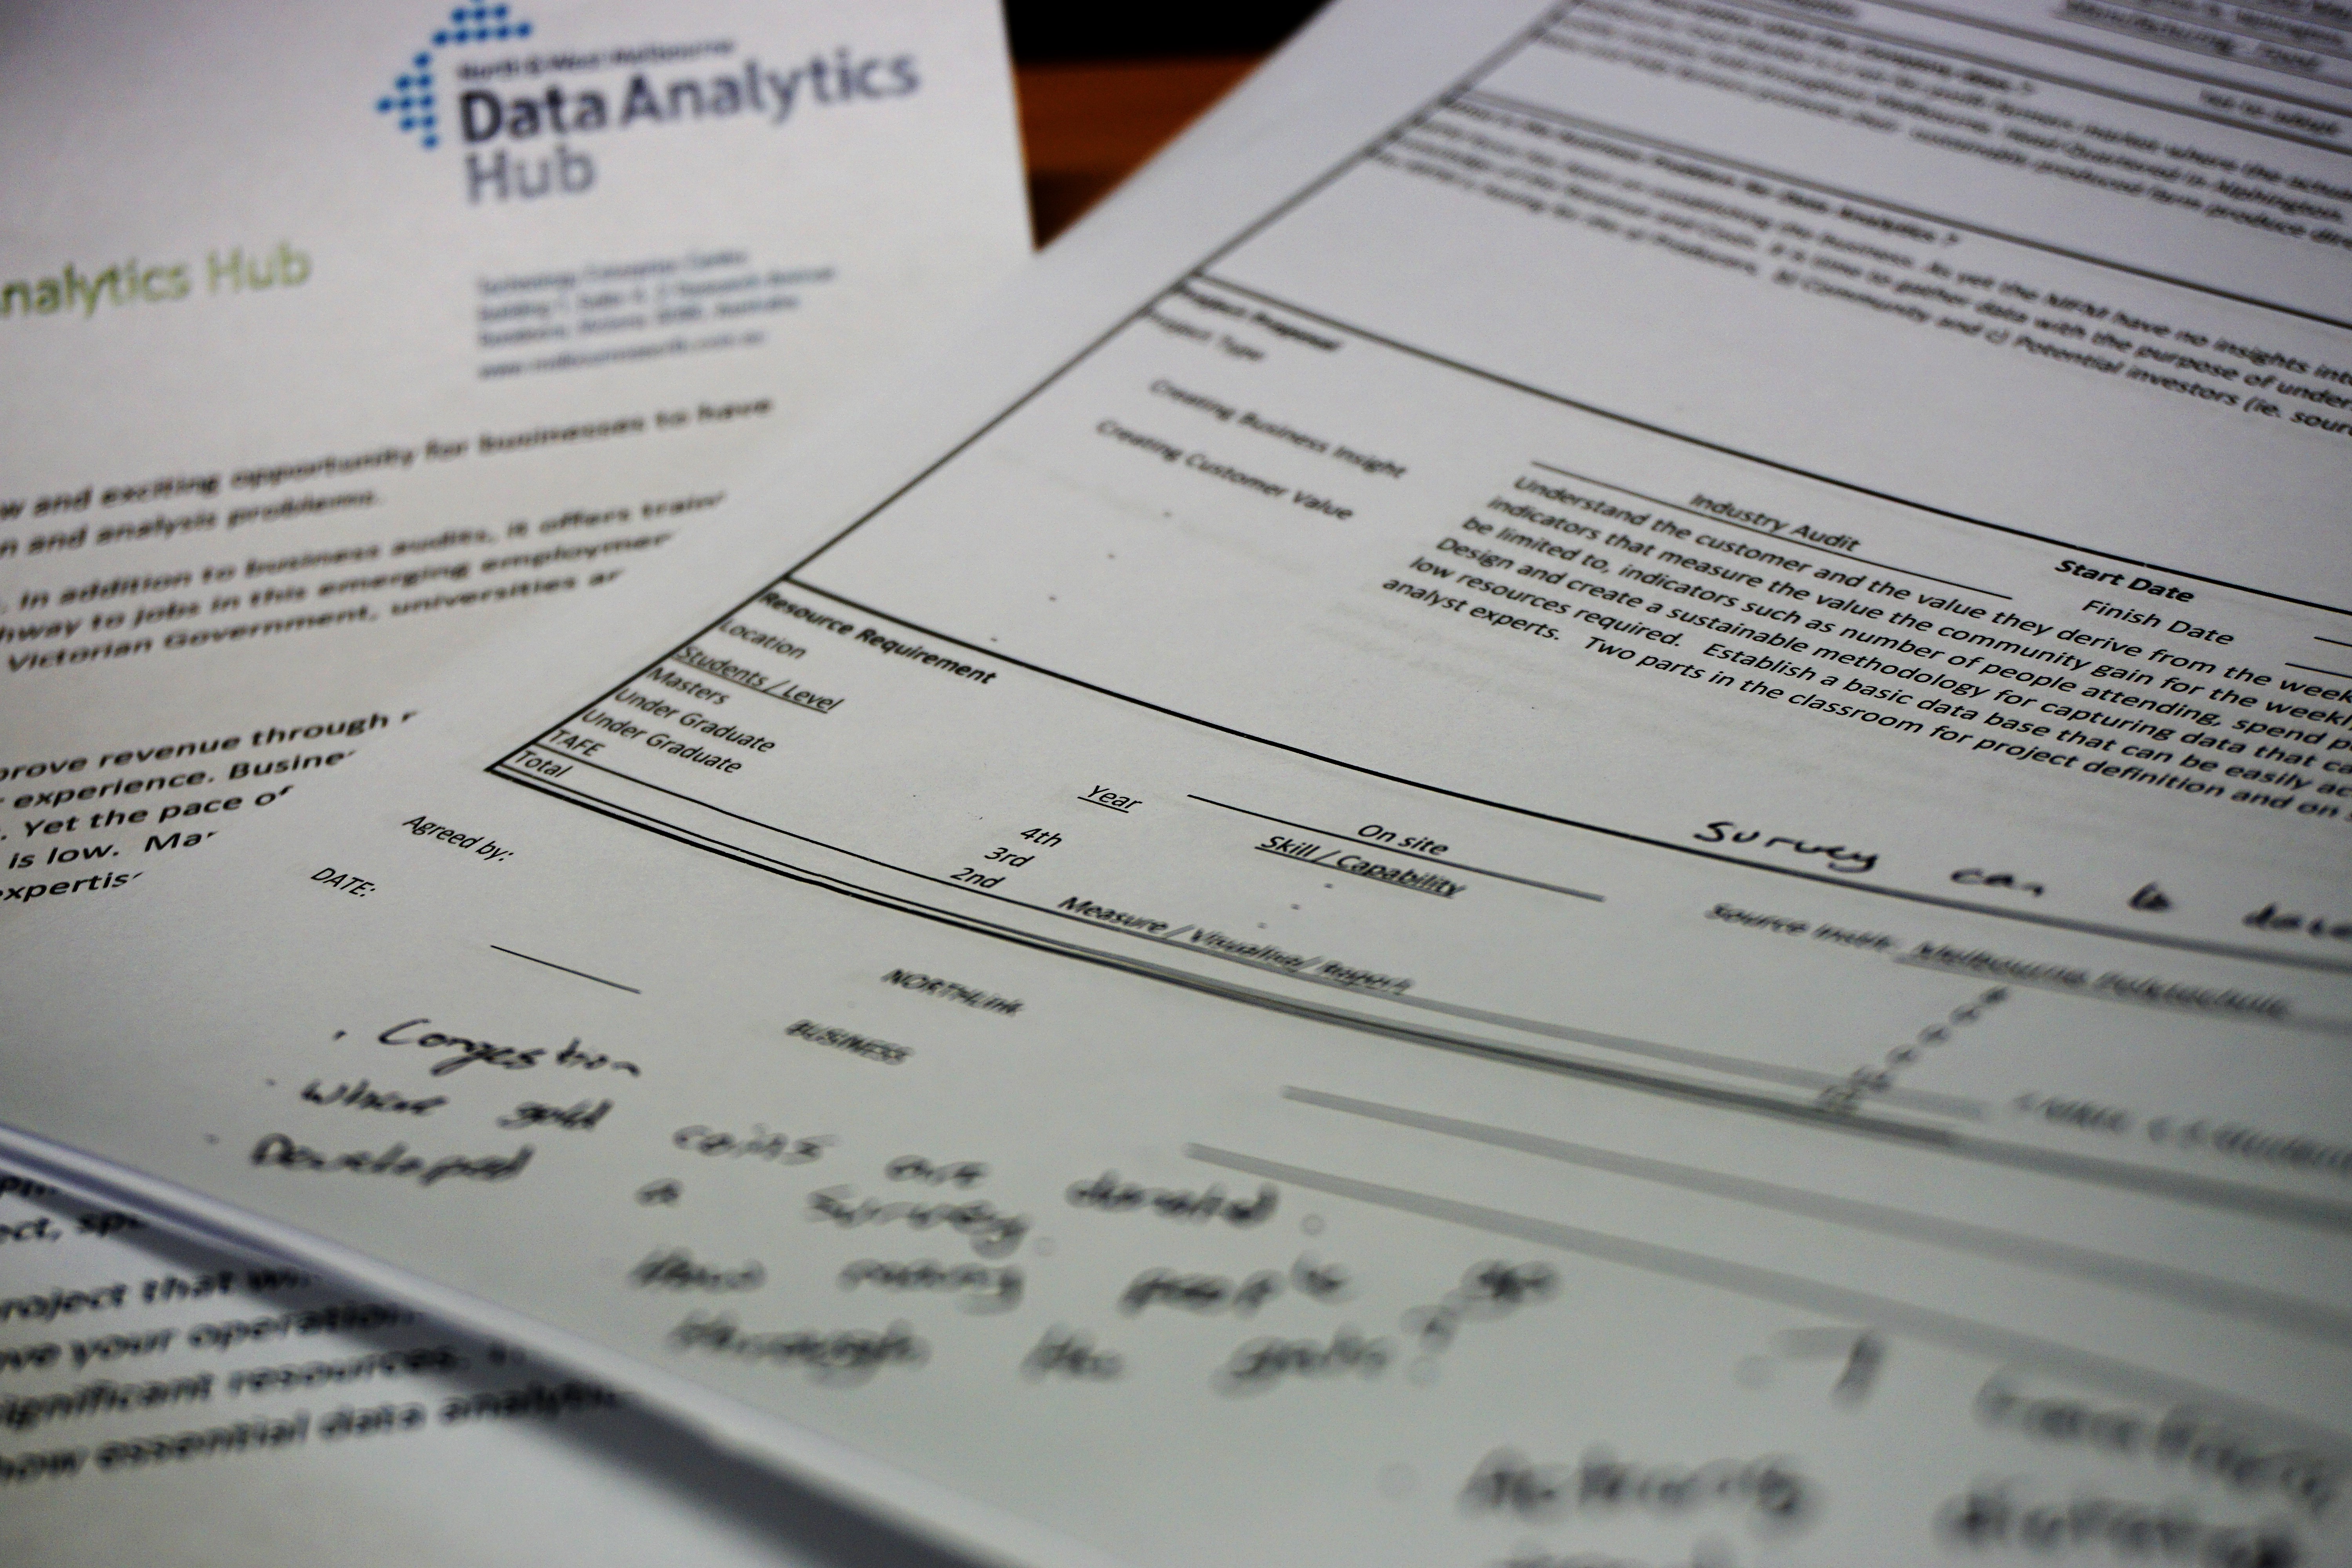
Business audit
Students form a team and undertake a diagnostic project that will look at the data generated in a business and advise on how it can be used to improve operations.
Major industry project
Students undertake a long form project that involves more significant resources. This addresses a business problem and adds real value, demonstrating how essential data analytics is in business. It involves implementing recommendations made through an earlier business audit project.

Benefits to business
Participating in a Hub project will give a business targeted and tangible solutions – a real business problem will be addressed or a new opportunity presented. In addition, businesses will contribute to the region’s emergence as a sophisticated data analytics hub. They will be part of the data analytics innovation community, ensuring their businesses will be always up-to-date with the latest thinking.

The student experience
Students benefit from the program through first-hand experience with real workplace data. Real datasets come in many forms and learning to deal with individual business requirements significantly increases employability. Work placement experience is becoming increasingly valued by employers and the Hub offers quality placements and projects to give students the best opportunity to succeed.

Other business involvement opportunities
There are several ways that a business can become involved if they do not have a defined project. They can:
- host or sponsor a data analytics training or briefing event
- become a paid partner of the Hub’s panel of data analytics businesses
- promote the Hub to business contacts who may need data solutions.

Capturing and measurement
While all businesses have data, there are occasions when a specific dataset is needed to achieve an outcome. This could be consumer flow and hotspots, industry trend data, average consumer wait times and more. Having this data can help a business make evidence-based decisions or shed light on unknown or neglected aspects of that business.
Output: Hard, raw information that may support existing beliefs with numerical evidence.

Definition, cleaning and governance
Raw data can be difficult to comprehend. It may be lacking or there may just be a raw volume that is too difficult for non-data specialists to take any useful meaning from. Having the definition of data will help a business to better understand what information it has, make staff aware of data that could potentially be useful if captured and help the business maintain data for future use or expansion.
Data cleaning and governance involves discovering missing information on currently held data, filling in the blanks to give a fuller picture of a data set.
Output: A dataset that is more complete (such as a database) that can be trusted as up to date and accurate.

Development and visualisation
While numbers alone can have significant meaning, visualising what the data means can completely change the understanding of what is happening. This can also greatly reduce the quantity of information that a business needs to tackle, as a single graph built by a student can represent hundreds to thousands of entries of data that can then be presented to stakeholders.
Output: Comprehensible representation of data that serves as a visual summary.
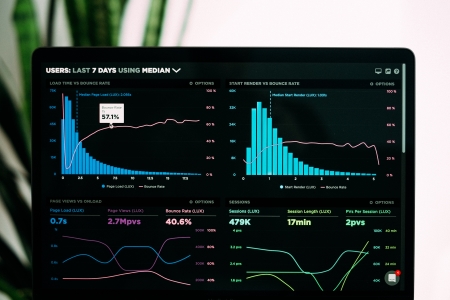
Statistical analysis and reporting
A short report can highlight key findings, giving advice on what to explore if a business has multiple data concerns or queries. Data students may notice trends that may not be apparent to others. Through analysis, students may be able to make suggestions to address business concerns or give warning based on information a business may not have been aware of.
Output: A summary of data findings and indications of what may have happened in a business or industry and why.
Forecasting
Using the evidence of pre-existing or collected data, students may be able to forecast and predict changes in industry or a business. With this information comes suggestions of how to keep ahead of competitors and make efficient decisions to match the future markets.
Output: An indication of what may happen to a business or industry in the future given current data and trends.